 |
 |
 |
|
| Annex 1 | |||
| 4.4 Interface DFM-FCTD |
 Contents Contents
|
|
|---|
1 Characterization of the Interface
The interface corresponds to the type "balancing against the results of another basic method".
While basic method FCTD - Functional Decomposition supplies the hierarchical refinement of functions (function tree) for the examined system/segment/SWCI down to the level of the elementary functions, the process illustration of DFM reflects the processes corresponding to the functions with the appropriate data flows, data stores, and external items. The data flow model also reflects an improved, detailed view of the individual FCTD functions.
The interactive adjustment is usually realized in such a way that-based on the upper-most level in the hierarchy-the next levels of the functions and processes are generated step-by-step so FCTD functions and DFM processes correspond directly to each other on the individual levels. In this connection, the required restructuring activities will be realized for functions or processes on the corresponding level, i. e. in case this is required because of a certain combination of functions into "functional areas" on the FCTD side, or because of the minimization of interfaces between processes on the DFM side.
2 Example
Figure 4.5 illustrates the interface relationship.
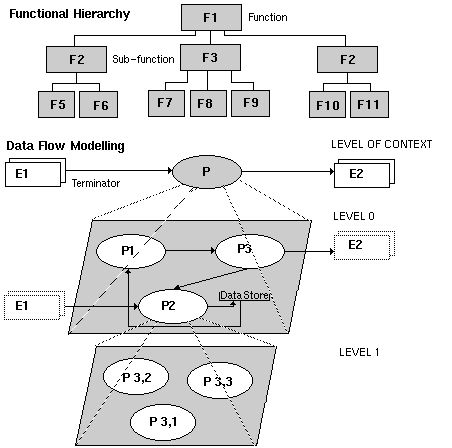
Figure 4.5: Example Interface DFM-FCTD
Explanation of the example:
Functions and processes correspond in the following way:
| F1 | 
| P |
| F2, F3, F4 |
| P1, P3, P2 |
| F7, F8, F9 |
| P3.1, P3.2, P3.3 |
3 Tool Support
The interface is mostly supported by tools in a manner making it possible to select the corresponding data flow diagram of a process hierarchy level-and vice versa-from a level of the functional hierarchy. This is helpful, both during the generation process and when navigating in the finished model. The consistency of the individual allocations is checked by the tool.
4 Literature
| /Achatzi, 91/ | chap. 3.2.3.8 Connection between Data Flow Diagrams and Structure Diagrams. |
| /Wieken, 90/ | chap. VI.3.1.5 Example for an Allocation. |
|
|
|
 GDPA Online
Last Updated 01.Jan.2002
Updated by Webmaster
Last Revised 01.Jan.2002
Revised by Webmaster
GDPA Online
Last Updated 01.Jan.2002
Updated by Webmaster
Last Revised 01.Jan.2002
Revised by Webmaster
|